Nevron Vision for SharePoint
by Nevron Software LLC
What is it all about?
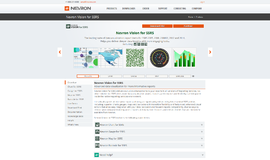
Nevron Vision for SharePoint delivers web parts needed to author advanced reports and dashboards inside any SharePoint page.
Video & Images
Images
Key Features
* Advanced Charting for SharePoint dashboards and reports: Nevron Chart for SharePoint is an advanced web part, which delivers a complete and unmatched set of 2D and 3D charting types, highly customizable axes, advanced data analysis, numerous tuning options and stunning visual effects to your SharePoint sites. It combines the industry leading Nevron Charting engine for ASP.NET together with the powerful Nevron Pivot Data Aggregation engine. This allows virtually any SharePoint user to visually create advanced pivot charts with truly unique and impressive looks. That is why it is considered to be the Microsoft Excel Pivot Chart analog in SharePoint context. * Advanced Gauges for SharePoint dashboards and reports: When an advanced web part that will monitor your critical data in SharePoint (2007, 2010 or 2013) is needed, you can’t go wrong with Nevron Gauge for SharePoint. The Gauge Web Part will provide you with a complete set of linear and radial gauges, numeric displays and state indicators, driven by pivot data aggregation. Using Nevron Gauge for SharePoint you can create complex gauges with multiple gauge areas, KPIs, Scorecards and Dashboards, which are configured visually and directly in SharePoint environment with no coding at all. * Advanced Maps for SharePoint dashboards and reports: Nevron Map for SharePoint is designed to provide an easy and powerful way to create choropleth maps that are tightly integrated with your data. The web part delivers an unmatched set of features related to visual quality, layout, data integration and data analysis. * Advanced Linear & Matrix Barcodes for any SharePoint page: Nevron Barcode for SharePoint delivers an easy and powerful way to display data driven linear and matrix barcodes directly inside SharePoint. It can display virtually all widely used barcode symbologies and is fully data-driven.
Compare Products
Select up to three two products to compare by clicking on the compare icon () of each product.
{{compareToolModel.Error}}


